gh-wrapped is Your GitHub Wrapped Year in Review, On Demand
Recent Decembers, I watch people share their “Spotify/etc. Wrapped” results and wonder about building a proper GitHub version. Various “GitHub Wrapped” websites pop up each year, but they always fall short for me:
- They only work for public contributions, and a lot of mine are now in private repos.
- They miss gists, repos created, and sponsorship data, but these are part of how I use GitHub.
- They’re only available during a narrow window in December or only consider the single year
- You can only check your own stats
I got tired of wondering, so I built gh-wrapped to give you a complete GitHub Wrapped on demand.
Note
gh-wrappedis a GitHub CLI extension that generates a year-in-review summary of your GitHub activity, inspired by Spotify Wrapped. Get detailed stats on your contributions, activity patterns, top languages, and more—all as formatted markdown.
Installation
gh extension install joshbeckman/gh-wrapped
That’s it. You have the GitHub CLI installed and authenticated (and jq for JSON parsing), you’re ready to go.
Run It Any Time, For Any Year, For Anyone
# Your stats for this year
gh wrapped

# Your stats for 2023
gh wrapped 2023

# Check someone else's public activity
gh wrapped 2024 octocat

# Save it as a gist
gh wrapped 2024 | gh gist create -f wrapped-2024.md
The third-party websites that appear each December are fine for a quick shareable image, but I wanted something I could run any time I’m curious. How did Q1 compare to Q4? What was my busiest month? Did I actually contribute more this year than last? These questions don’t care about December.
What You Get
The tool pulls from GitHub’s GraphQL contributionsCollection endpoint which is the same data source that powers your profile’s contribution graph. This means it includes both public and private contributions in the totals.
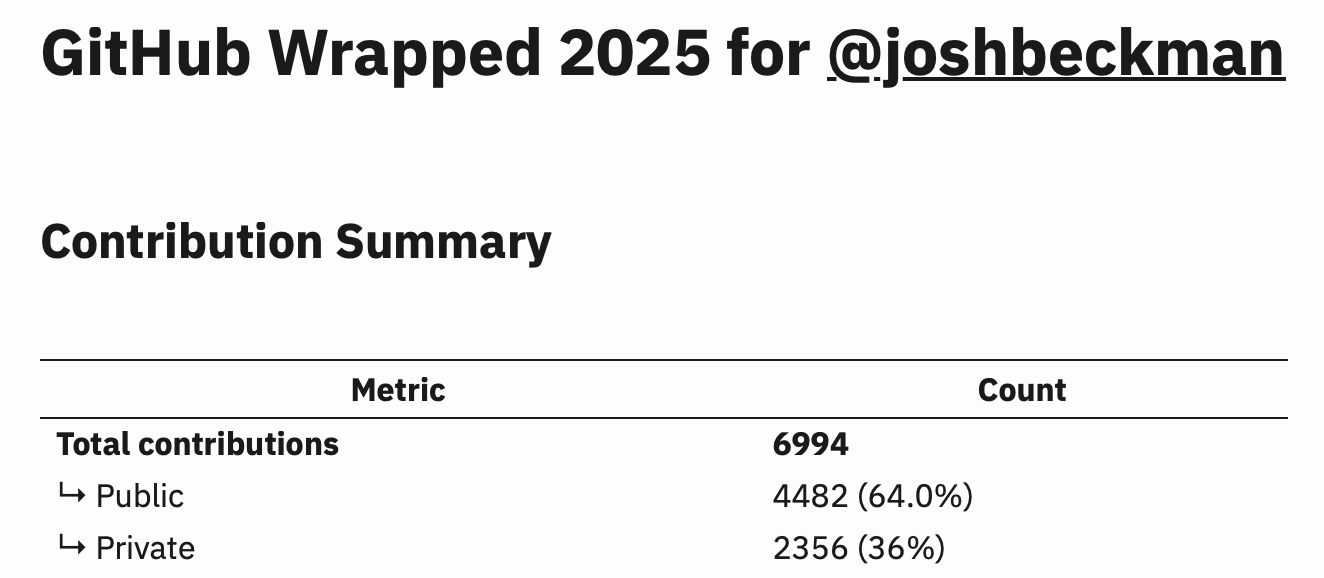
- Contribution Summary with public/private breakdown
- Activity Patterns: busiest day of week, longest streak, peak activity day
- Visual Charts for daily and monthly activity (ASCII bar charts in your terminal)
- Top Languages by commits
- Top Repositories by commits
- Repositories Created that year
- Gists Created (including private ones)
- GitHub Sponsors activity (when checking your own stats)
- Profile Stats: stars, followers, following
Note
See an example at this gist of my 20219 GitHub Wrapped generated with this script.
Private Contributions
This was the main reason I built this. GitHub’s API provides the total count of private contributions through restrictedContributionsCount, which those web-based tools often ignore or can’t access. The detailed per-repo and per-language breakdowns only cover public repos (GitHub’s API doesn’t expose private repo details), but at least your totals reflect reality.
Warning
GitHub only provides the contribution count (not details on whether they are commits/PRs/etc) for private repos. I tried making it actually crawl through a year’s worth of private repo commits/PRs/etc. to calculate the count, but GitHub API rate limits inevitably make the whole thing come crashing down.
The output clearly labels what’s public vs private so you know exactly what you’re looking at.
Note
This is my third
ghextension. Previously released: gh-pr-staleness and gh-view-md
The source is on GitHub with examples and full documentation. Contributions are welcome!
Reference
-
Permalink (
2025.BLG.201) - On
- In Blog / Practicing
- Tagged tools, github, open-source, cli, year-in-review
- Edit
| ← Previous | Next → |
| Mastodon and Bluesky Wrapped 2025 | gh-nvim-username-keywords: GitHub @-mention Autocomplete in Your Neovim Editor |